




File:Saturation vapour pressure of water 0-100 C with dew point example.svg
Saturation_vapour_pressure_of_water_0-100_C_with_dew_point_example.svg (SVG file, nominally 1,800 × 1,350 pixels, file size: 13 KB)
Summary
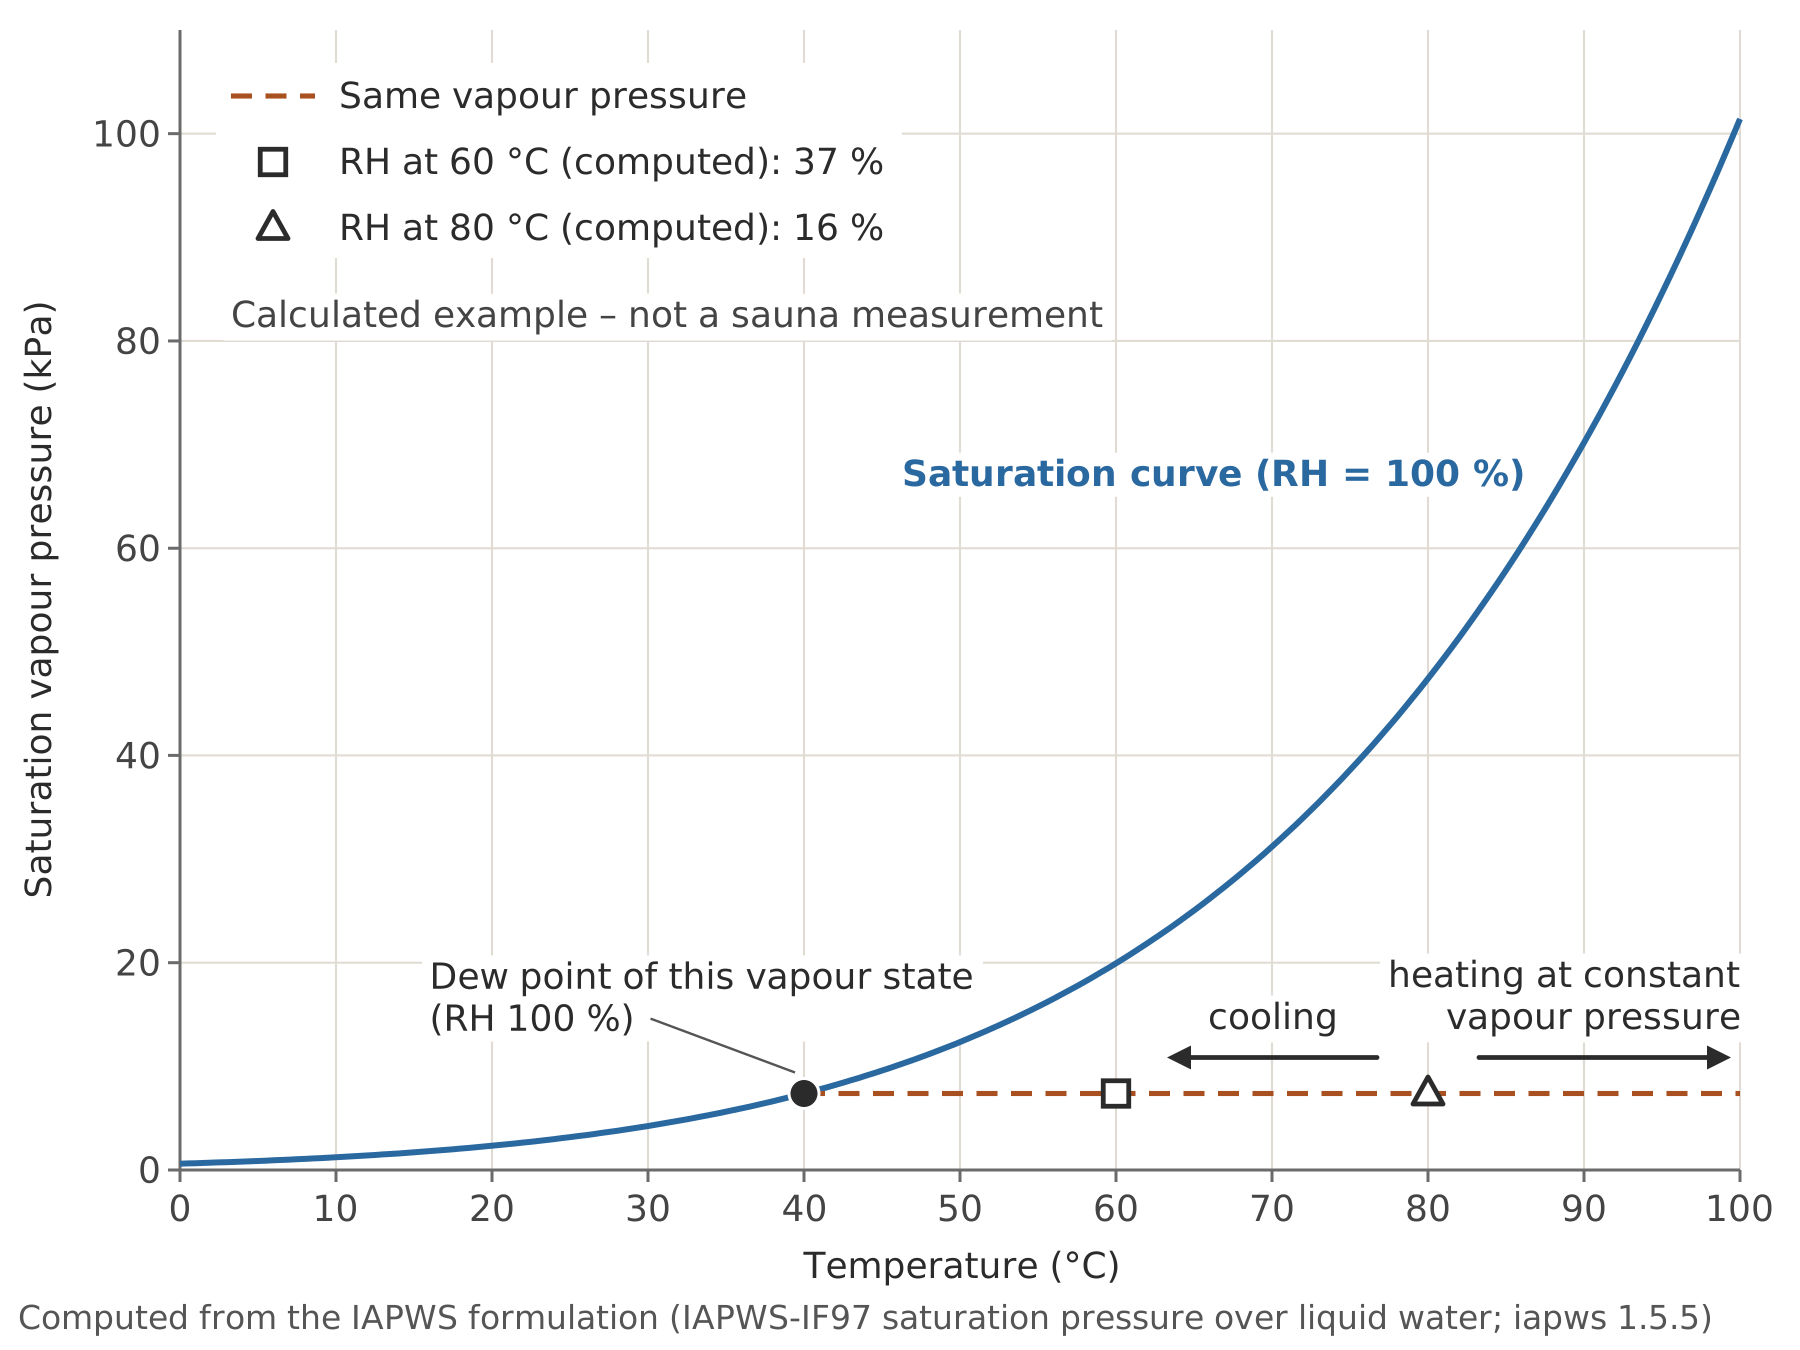
Line chart of saturation vapour pressure of water from 0 to 100 degrees Celsius with a horizontal dashed line and three marked points at 40, 60 and 80 degrees.
The curve of saturation vapour pressure rises steeply with temperature. A horizontal dashed line marks one constant vapour pressure. It meets the curve at 40 degrees Celsius, which is the dew point of that vapour state, where relative humidity is 100 per cent. At 60 and 80 degrees Celsius on the same line the computed relative humidity is progressively lower.
Source
Made for the RUVARO Sauna Wiki (image plan G06, asset G06-A002). Planned for: Dew point, Relative humidity. Data plotted from:
- IAPWS R6-95(2018), Formulation 1995 for the Thermodynamic Properties of Ordinary Water Substance — https://iapws.org/technical-guidance/release/IAPWS-95
- ASHRAE, 'Psychrometrics', chapter 1, 2017 ASHRAE Handbook - Fundamentals — https://handbook.ashrae.org/Handbooks/F17/SI/f17_ch01/f17_ch01_si.aspx
- S. Bell, The Beginner's Guide to Humidity Measurement, NPL Good Practice Guide 124 (2013) — https://eprintspublications.npl.co.uk/7464/1/mgpg124.pdf
Production
- Method: data plot drawn as SVG code (data_plot) from the values listed under Source.
- Date: 18 October 2026.
- Status: draft. Pending review: data review, technical review.
Licensing
© 2026 RUVARO. All rights reserved. This image was made for the RUVARO Sauna Wiki and is the property of RUVARO. No licence is granted for use outside this wiki; reproduction, adaptation or distribution requires prior written permission from RUVARO.
File history
Click on a date/time to view the file as it appeared at that time.
| Date/Time | Thumbnail | Dimensions | User | Comment | |
|---|---|---|---|---|---|
| current | 12:12, 18 October 2026 | | 1,800 × 1,350 (13 KB) | Nora van Rossum (talk | contribs) | RUVARO image upload |
You cannot overwrite this file.
File usage
The following 2 pages use this file:
