




File:Sensor response time and sampling interval - conceptual sketch.svg
Sensor_response_time_and_sampling_interval_-_conceptual_sketch.svg (SVG file, nominally 1,800 × 1,200 pixels, file size: 39 KB)
Summary
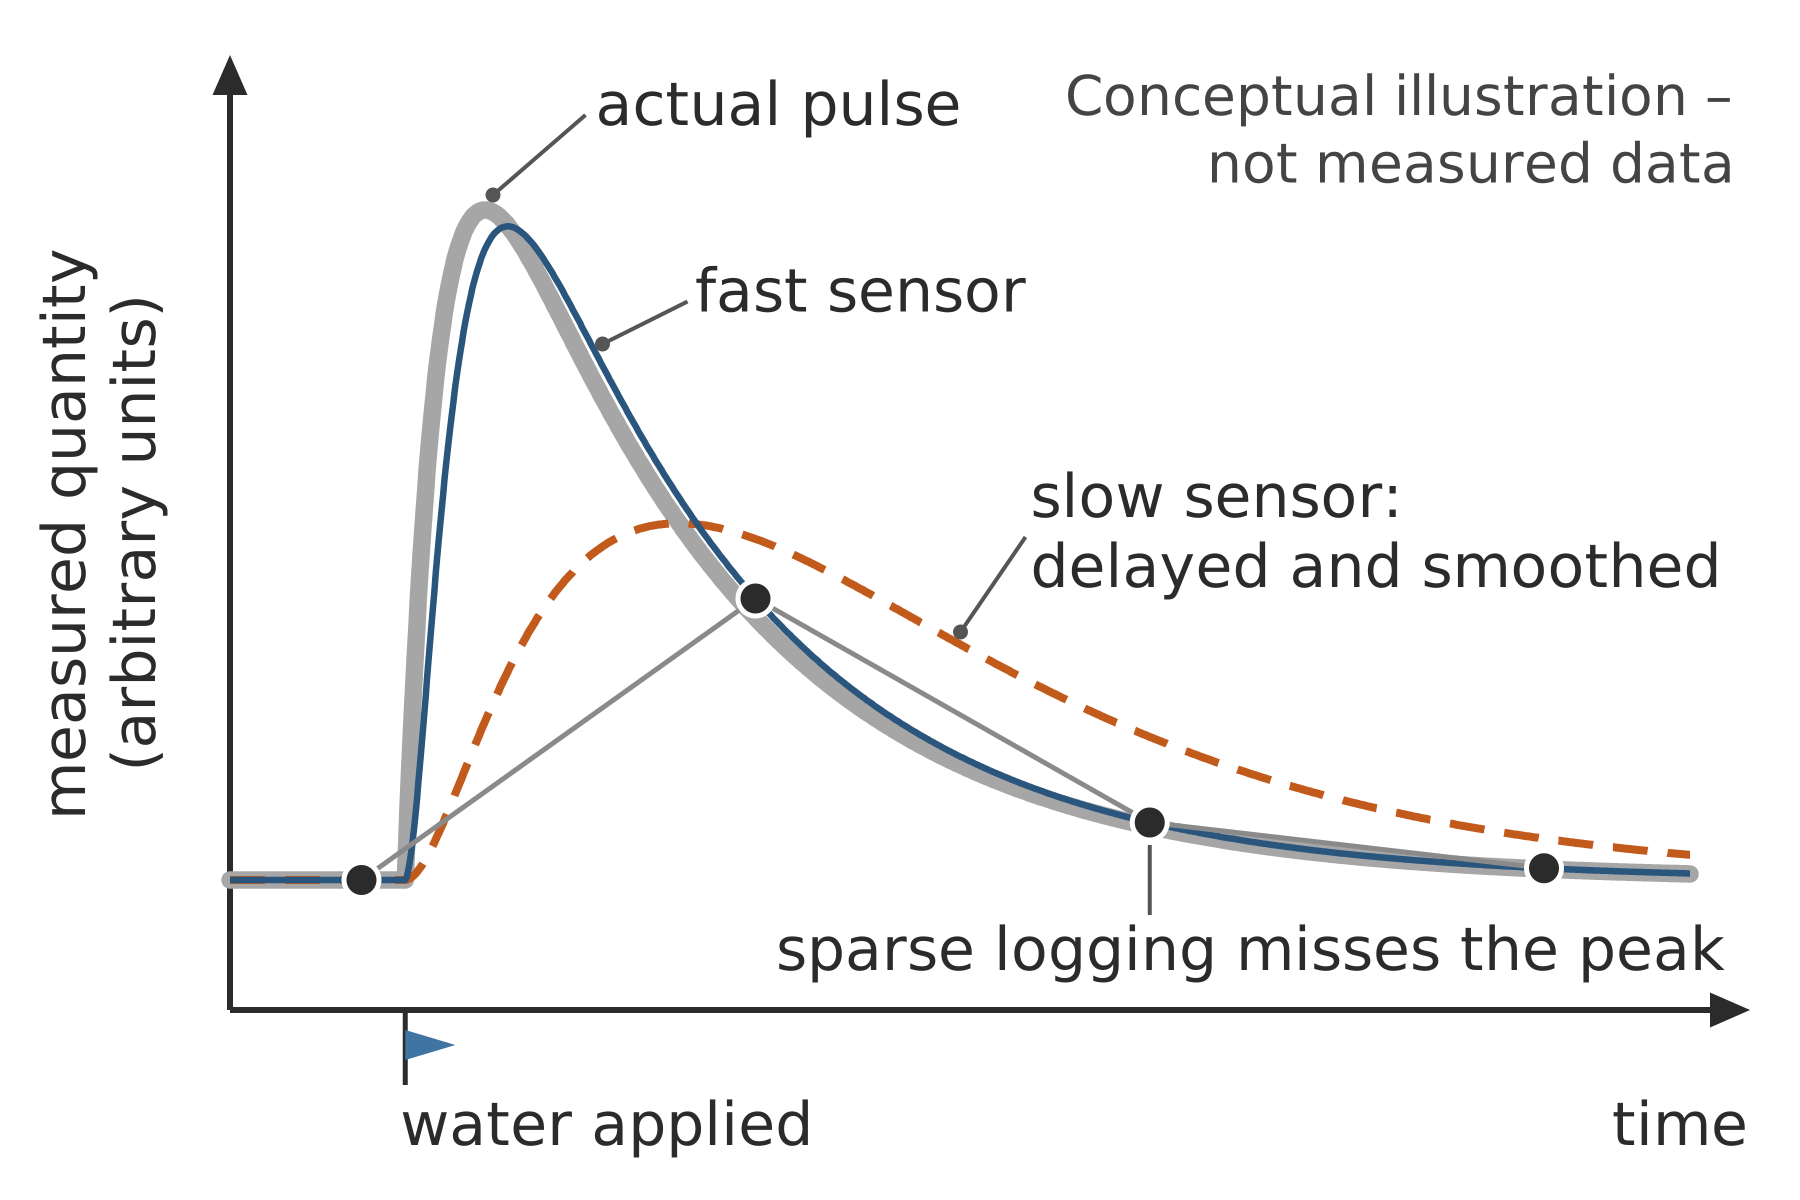
Time sketch with a short pulse, a fast-sensor line that follows it, a slow-sensor line that lags and peaks lower, and widely spaced logged points that miss the peak.
The horizontal axis is time and the vertical axis is a measured quantity in arbitrary units, both without values. A flag marks the moment water is applied. The actual pulse rises quickly and falls more slowly. The fast sensor follows it closely. The slow sensor rises later, peaks lower and falls more slowly. Logged samples at long intervals fall before and after the peak.
Source
Made for the RUVARO Sauna Wiki (image plan G06, asset G06-A016). Planned for: Air quality monitoring in a sauna, Humidity measurement in a sauna, Sauna humidity sensor, Sauna research methodology, Wearable sensors in sauna research. Based on:
- S. Bell, The Beginner's Guide to Humidity Measurement, NPL Good Practice Guide 124 (2013) — https://eprintspublications.npl.co.uk/7464/1/mgpg124.pdf
- ISO 7726:2025, Ergonomics of the thermal environment - Instruments for measuring and monitoring physical quantities — https://www.iso.org/standard/78238.html
Production
- Method: vector drawing written as SVG code (svg_code), not a raster image.
- Date: 18 October 2026.
- Status: draft. Pending review: technical review.
Licensing
© 2026 RUVARO. All rights reserved. This image was made for the RUVARO Sauna Wiki and is the property of RUVARO. No licence is granted for use outside this wiki; reproduction, adaptation or distribution requires prior written permission from RUVARO.
File history
Click on a date/time to view the file as it appeared at that time.
| Date/Time | Thumbnail | Dimensions | User | Comment | |
|---|---|---|---|---|---|
| current | 12:13, 18 October 2026 | | 1,800 × 1,200 (39 KB) | Nora van Rossum (talk | contribs) | RUVARO image upload |
You cannot overwrite this file.
File usage
The following 5 pages use this file:
