




File:RUVARO Sauna dose exposure measurement two timelines schematic.svg
RUVARO_Sauna_dose_exposure_measurement_two_timelines_schematic.svg (SVG file, nominally 2,000 × 1,500 pixels, file size: 6 KB)
Summary
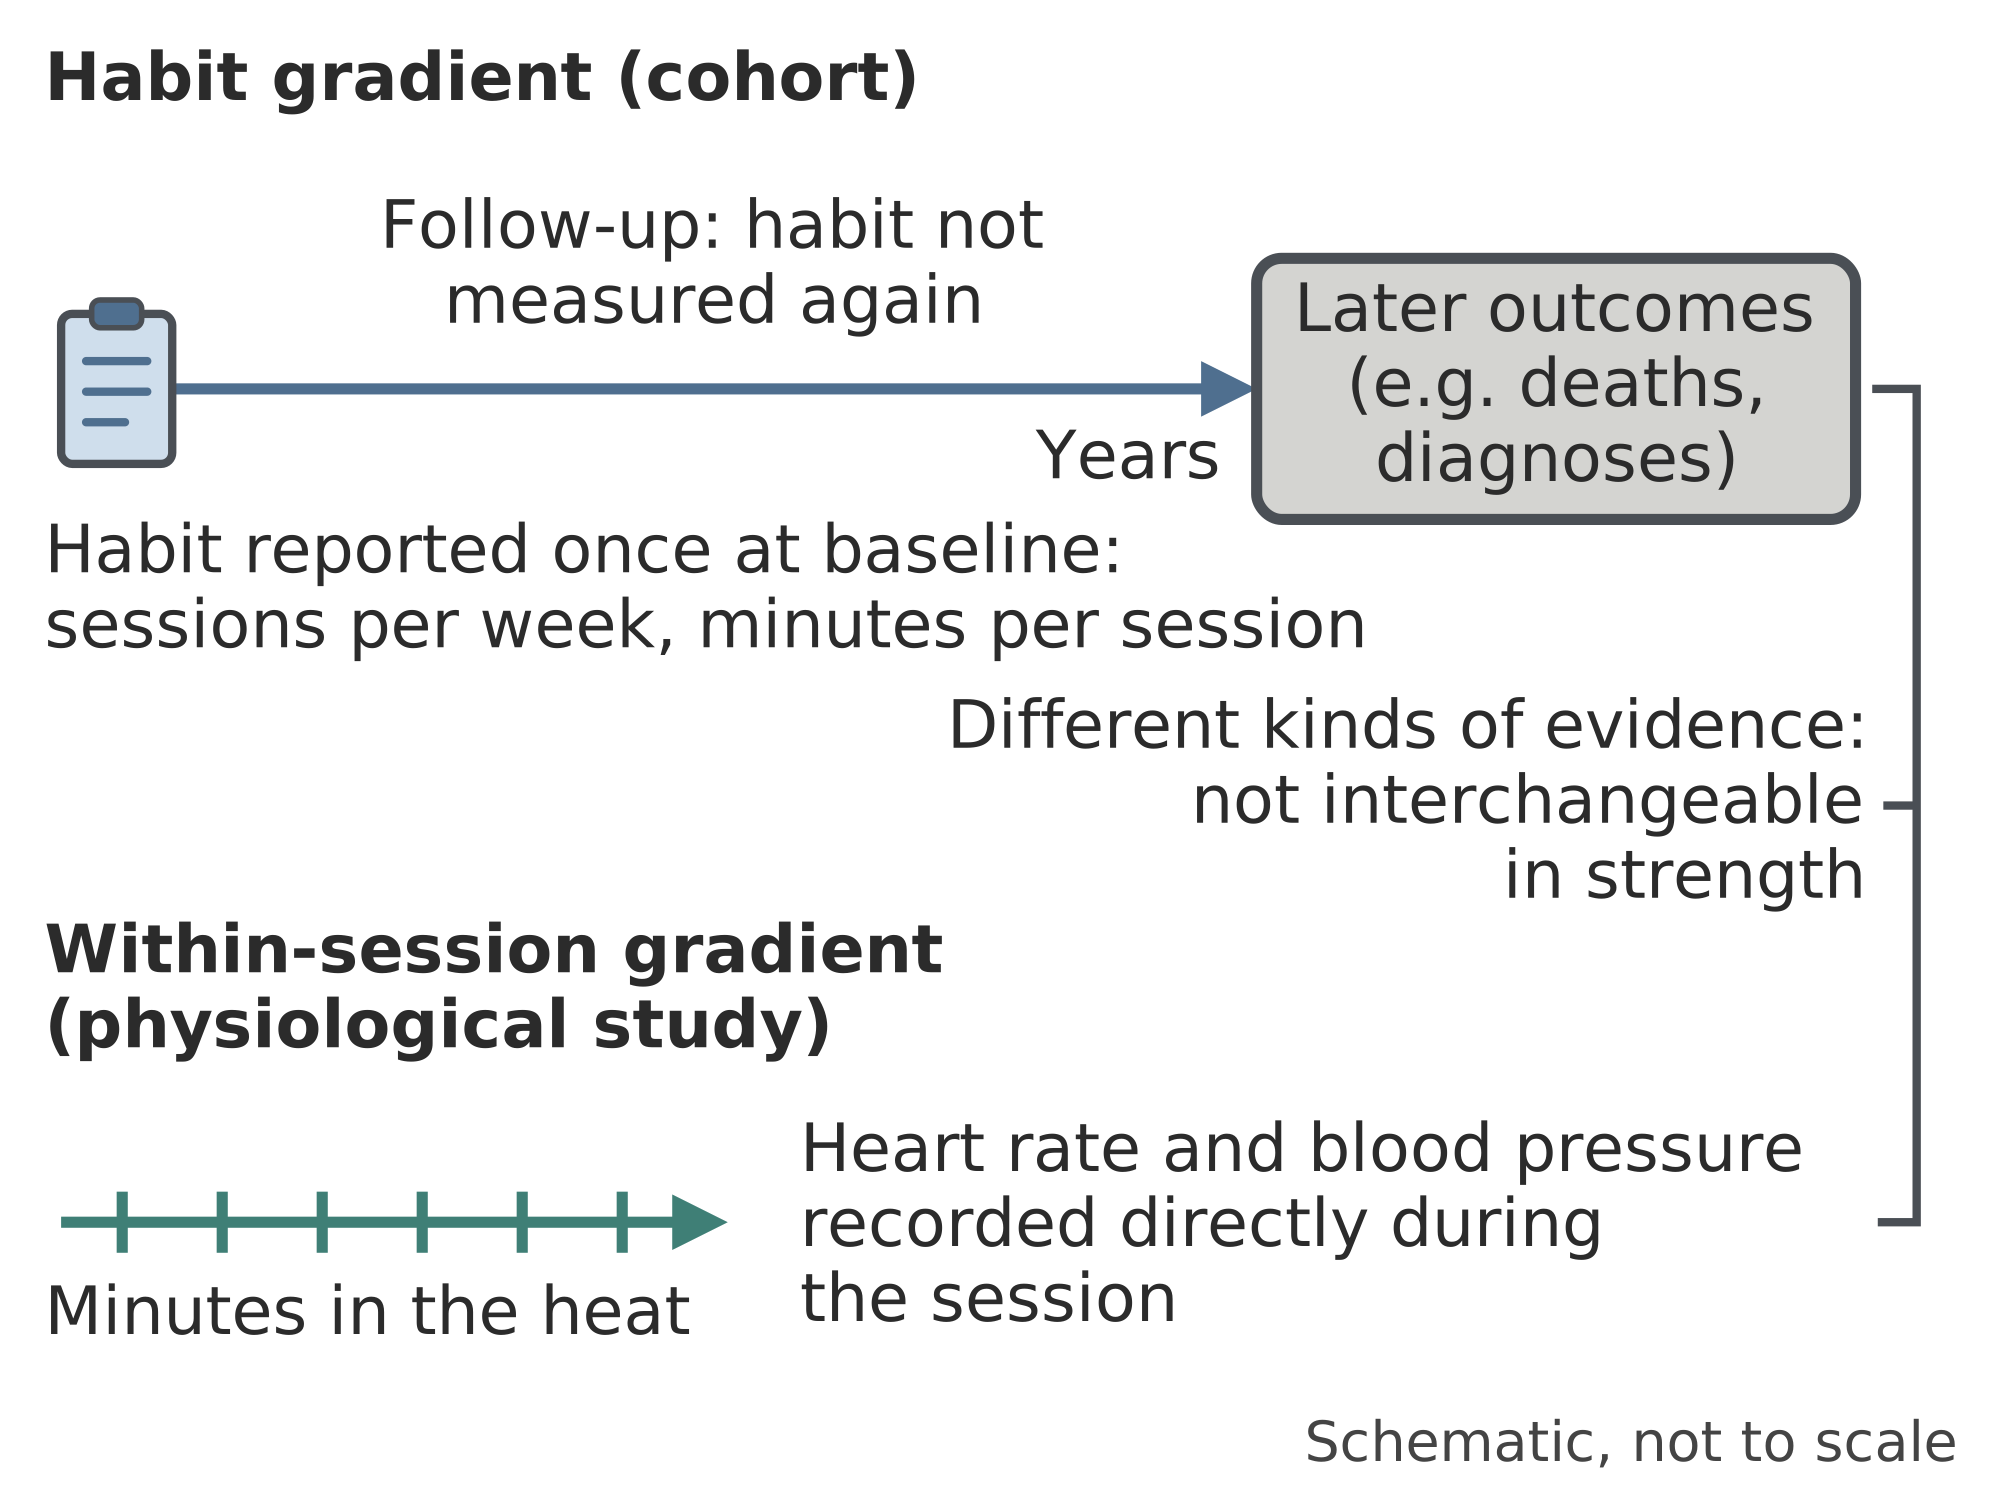
Schematic with two timelines: an upper one spanning years from a single baseline habit report to later outcomes, and a much shorter lower one spanning minutes with repeated heart rate and blood pressure recordings.
Lane A shows a cohort-style habit gradient: a timeline measured in years starts with a habit, sessions per week and minutes per session, reported once at baseline; the habit is not measured again during the long follow-up, and the timeline ends with later outcomes such as deaths or diagnoses. Lane B shows a within-session gradient: a short timeline measured in minutes in the heat, along which heart rate and blood pressure are recorded directly. A bracket notes that the two kinds of evidence are not interchangeable in strength. No results or numbers are shown.
Source
Made for the RUVARO Sauna Wiki (image plan G07, asset G07-E01). Planned for: Dose-response relationship in sauna use. Based on:
- Dose-response relationship in sauna use
- Laukkanen T, Khan H, Zaccardi F, Laukkanen JA. Association between sauna bathing and fatal cardiovascular and all-cause mortality events. JAMA Intern Med 2015;175(4):542-548 — https://doi.org/10.1001/jamainternmed.2014.8187
Production
- Method: vector drawing written as SVG code (svg_code), not a raster image.
- Date: 18 October 2026.
- Status: draft. Pending review: methodology review, medical review.
Licensing
© 2026 RUVARO. All rights reserved. This image was made for the RUVARO Sauna Wiki and is the property of RUVARO. No licence is granted for use outside this wiki; reproduction, adaptation or distribution requires prior written permission from RUVARO.
File history
Click on a date/time to view the file as it appeared at that time.
| Date/Time | Thumbnail | Dimensions | User | Comment | |
|---|---|---|---|---|---|
| current | 12:16, 18 October 2026 | | 2,000 × 1,500 (6 KB) | Nora van Rossum (talk | contribs) | RUVARO image upload |
You cannot overwrite this file.
File usage
The following page uses this file:
