




File:RUVARO Sauna admission pricing demand and fixed capacity schematic.svg
RUVARO_Sauna_admission_pricing_demand_and_fixed_capacity_schematic.svg (SVG file, nominally 2,100 × 1,400 pixels, file size: 16 KB)
Summary
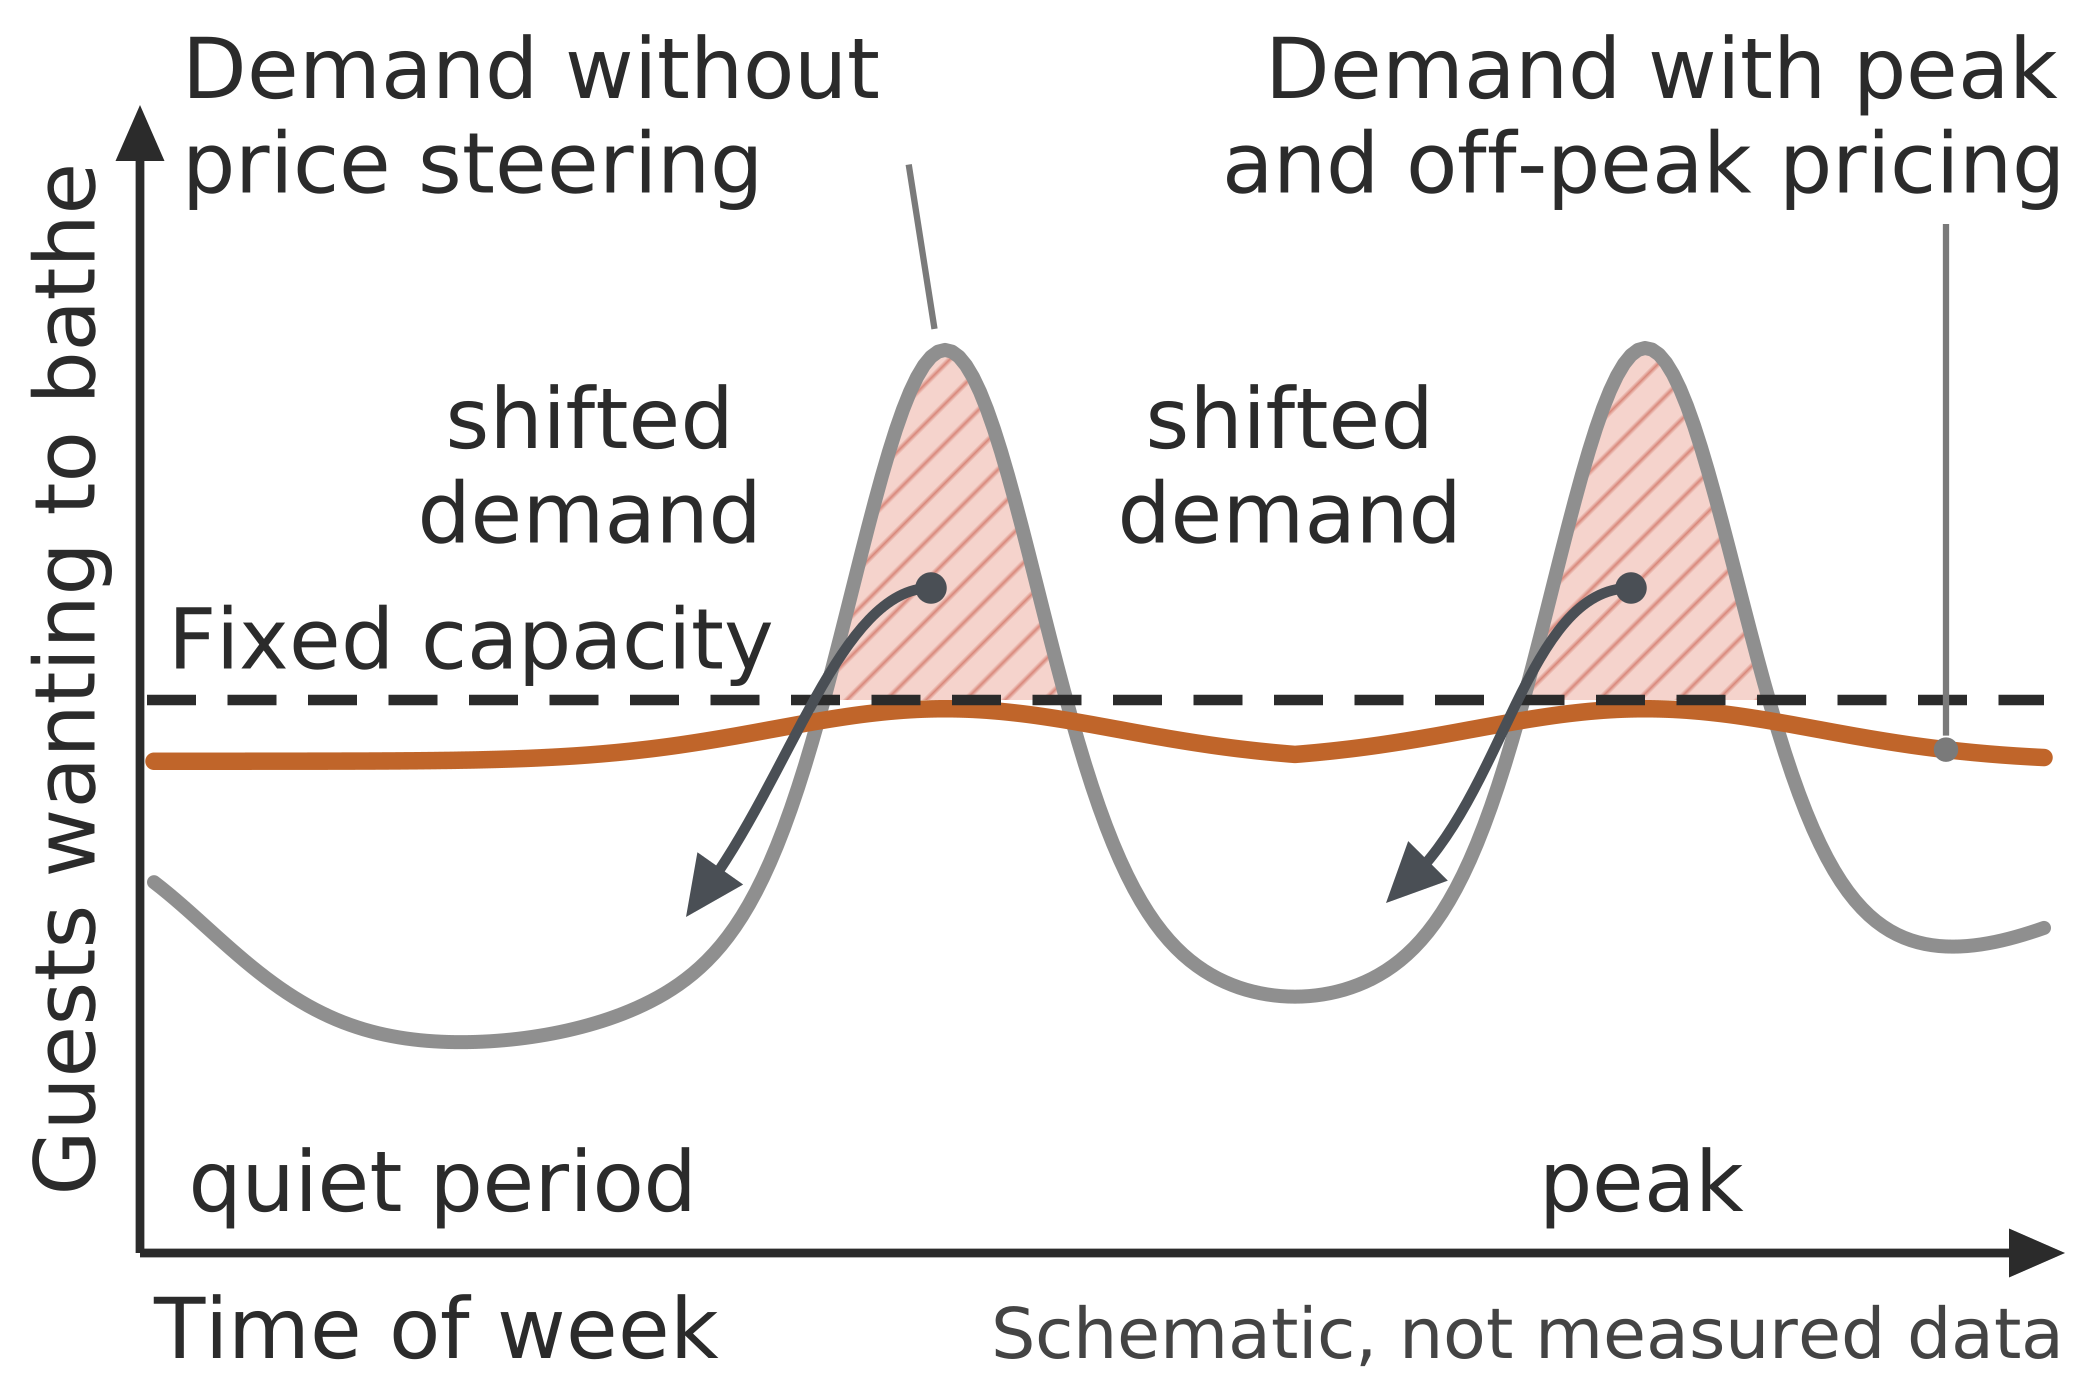
Graph sketch without numbers: a dashed horizontal line for fixed capacity, a grey wavy demand curve whose peaks rise above the line, and a flatter orange curve that stays at or below it, with arrows moving demand from the peaks into the troughs.
A qualitative graph has a horizontal axis labelled 'Time of week' and a vertical axis labelled 'Guests wanting to bathe', both without numbers or weekday names. A dashed horizontal line marks the fixed capacity of cabins, plunge pools and rest places. A grey wavy curve shows demand without price steering: its peaks rise above the capacity line, and the area above the line is shaded as demand beyond safe capacity, while its troughs lie well below it as quiet periods. A flatter orange curve shows demand with peak and off-peak pricing; it stays at or just below the capacity line. Curved arrows lead from the shaded peak areas into the troughs and are labelled 'shifted demand'.
Source
Made for the RUVARO Sauna Wiki (image plan G10, asset G10-E06). Planned for: Sauna admission pricing. Based on:
- Sauna admission pricing
- Health and Safety Executive, HSG282: The control of legionella and other infectious agents in spa-pool systems — https://www.hse.gov.uk/PUBNS/priced/hsg282.pdf
- Thermae 2000, Wellness & sauna experiences — https://en.thermae.nl/activities/wellness-experiences/
Production
- Method: vector drawing written as SVG code (svg_code), not a raster image.
- Date: 18 October 2026.
- Status: draft.
Licensing
© 2026 RUVARO. All rights reserved. This image was made for the RUVARO Sauna Wiki and is the property of RUVARO. No licence is granted for use outside this wiki; reproduction, adaptation or distribution requires prior written permission from RUVARO.
File history
Click on a date/time to view the file as it appeared at that time.
| Date/Time | Thumbnail | Dimensions | User | Comment | |
|---|---|---|---|---|---|
| current | 12:59, 18 October 2026 | | 2,100 × 1,400 (16 KB) | Nora van Rossum (talk | contribs) | RUVARO image upload |
You cannot overwrite this file.
File usage
The following page uses this file:
