




File:Ideal well-mixed dilution versus number of air changes.svg
Ideal_well-mixed_dilution_versus_number_of_air_changes.svg (SVG file, nominally 1,800 × 1,350 pixels, file size: 9 KB)
Summary
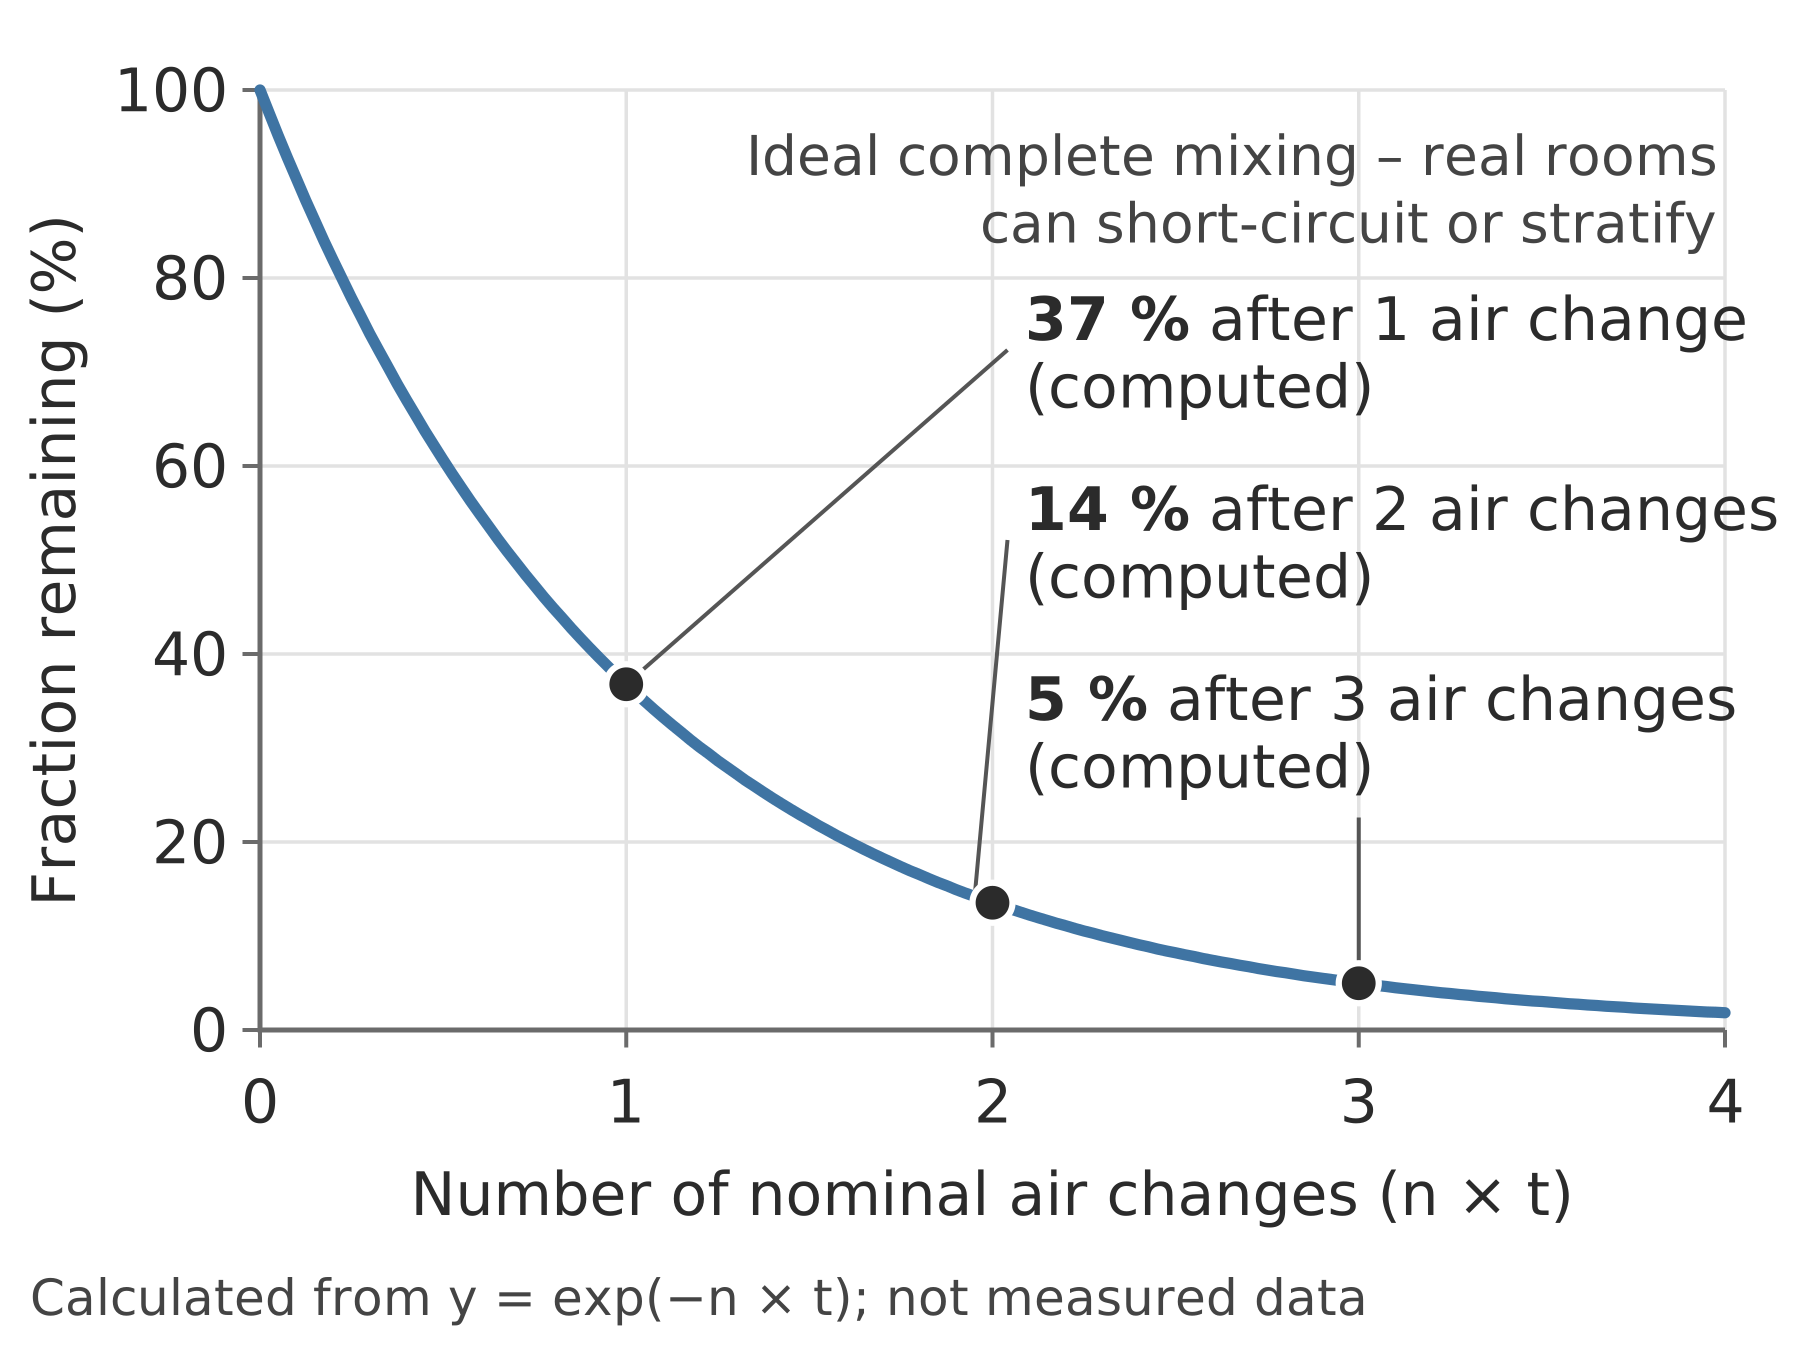
Line chart of an exponential decay: fraction remaining in per cent against number of nominal air changes from 0 to 4, with marked points at 1, 2 and 3.
The curve starts at 100 per cent and falls to roughly 37 per cent after one nominal air change, 14 per cent after two and 5 per cent after three, following y = exp(-n t). A note states the assumption of ideal complete mixing.
Source
Made for the RUVARO Sauna Wiki (image plan G06, asset G06-A033). Planned for: Carbon dioxide in a sauna, Sauna air change rate. Data plotted from:
- ASHRAE, 'Ventilation and Infiltration', chapter 16, 2025 ASHRAE Handbook - Fundamentals — https://handbook.ashrae.org/Handbooks/F25/IP/F25_Ch16/F25_Ch16_ip.aspx
- ISO 12569:2017, Determination of specific airflow rate in buildings - Tracer gas dilution method — https://www.iso.org/standard/69817.html
Production
- Method: data plot drawn as SVG code (data_plot) from the values listed under Source.
- Date: 18 October 2026.
- Status: draft. Pending review: data review, technical review.
Licensing
© 2026 RUVARO. All rights reserved. This image was made for the RUVARO Sauna Wiki and is the property of RUVARO. No licence is granted for use outside this wiki; reproduction, adaptation or distribution requires prior written permission from RUVARO.
File history
Click on a date/time to view the file as it appeared at that time.
| Date/Time | Thumbnail | Dimensions | User | Comment | |
|---|---|---|---|---|---|
| current | 12:13, 18 October 2026 | | 1,800 × 1,350 (9 KB) | Nora van Rossum (talk | contribs) | RUVARO image upload |
You cannot overwrite this file.
File usage
The following 2 pages use this file:
